Speed/Ping test graphs with Clojure and Raspberry Pi
Sat, Aug 24, 2013I’m often complaining about my ISP quality. Sometimes pings are high, sometimes download speed goes down. So I decided to make sure it’s my ISP fault and not just my opinion based on my hate to them.
How to do so? Let’s collect data about download speed and pings over time, and show some graphs based on that data.
I have unused Raspberry Pi right now, so it will be used to collect data.
Speedtest data
For speedtest I will be using python script that uses speedtest.net servers. Pi is running Pidora right now, so let’s install script dependencies.
yum -y install python-argparse python-lxml
Script is hosted on github. Let’s get the script.
mkdir ~/scripts
wget https://raw.github.com/Janhouse/tespeed/master/tespeed.py -O ~/scripts/speedtest.py
You can test script running it with:
python ~/scripts/speedtest.py
Now let’s wrap python script into additional shell script to store time of data collection in csv. I’m not sure if I need time for now, but let’s keep it anyway. We will silence stderr from the script and output results as csv.
~/bin/speedtest.zsh:
#!/usr/bin/zsh

echo "\"$(date -R)\",$(python ~/scripts/tespeed.py --csv -s)"
Let’s put script into crontab to run every 5 minutes, also let’s redirect stderr to /dev/null in case of Ethernet unavailability or some other issues.
crontab:
*/5 * * * * ~/bin/speedtest.zsh 2>/dev/null >> ~/.speedtest.csv
##Ping data
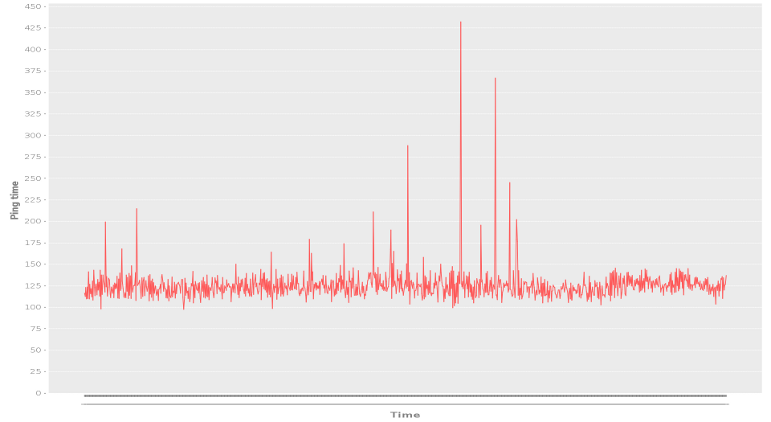
For ping data we will be running ping command with 100 packets (ping -c 100) with google dns as target (8.8.8.8) and storing avg value with time to csv file.
~/bin/pingtest.zsh:
#!/usr/bin/zsh

AVG=$(ping -c 100 8.8.8.8 | grep rtt | sed -r 's#.*\=\s.+/(.+)/.+/.+#\1#')

echo "\"$(date -R)\",$AVG"
crontab:
*/5 * * * * ~/bin/pingtest.zsh 2>/dev/null >> ~/.pingtest.csv
##Graphs
For data visualization let’s use Clojure with Incanter. Here is clojure code:
(ns incanter-graphs.core
(:require [incanter.core :refer :all]
[incanter.stats :refer :all]
[incanter.charts :refer :all]
[clojure-csv.core :refer :all])
(:gen-class))
(defn to-f [is] (Float/parseFloat is))
(defn get-f-col [data col]
(map to-f (sel data :cols col)))
(defn init-chart [data rng {:keys [x-label y-label]}]
(line-chart rng data :x-label x-label
:y-label y-label))
(defn add-to-chart [chart data rng]
(reduce #(add-categories %1 rng %2) chart data))
(defn draw-file [filename cols & {:as opts}]
(let [data (slurp filename)
csv (parse-csv data :delimiter \,)
rng (range 0 (count csv))
data (map (partial get-f-col csv) cols)
chart (init-chart (first data) rng opts)
chart-to-show (add-to-chart chart (rest data) rng)]
(view chart-to-show)))
(defn -main [speedfile pingfile & args]
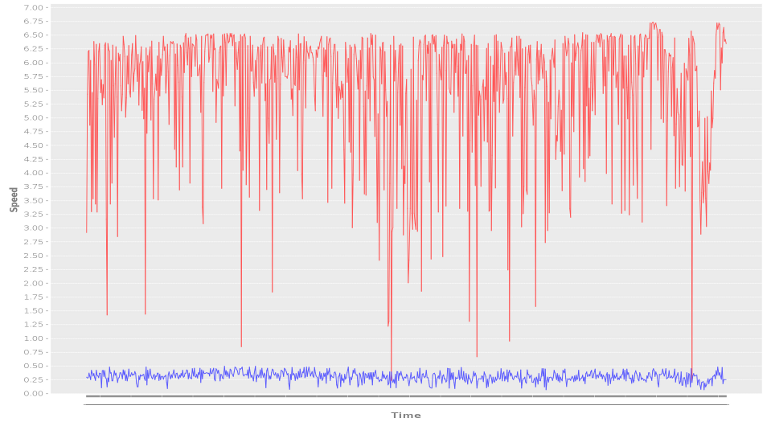
(draw-file speedfile [1 2] :x-label "Time" :y-label "Speed")
(draw-file pingfile [1] :x-label "Time" :y-label "Ping time"))
Let’s put all launch process to Makefile:
Makefile:
default:
	scp raspberry-pi.local:.speedtest.csv /tmp/
	scp raspberry-pi.local:.pingtest.csv /tmp/
	#Remove lines with only time (script failure)
	grep "[^,]$$" /tmp/.speedtest.csv > /tmp/.speedtest-fixed.csv
	grep "[^,]$$" /tmp/.pingtest.csv > /tmp/.pingtest-fixed.csv
	lein run /tmp/.speedtest-fixed.csv /tmp/.pingtest-fixed.csv
I adjusted my router, so QoS daemon will give maximum priority to traffic from my Raspberry Pi, so data will be cleaner. And now we can see some visualization.